HiC-Pro Results
Results presented in this section come from the analysis of the IMR90 replicate 1 sample from Dixon et al (2012).
It is important to note that in parallele mode, HiC-Pro will generate statistics file for each reads chunck. Then, when all chuncks are merged, statistics files are also combined in a single stat file available in the same directory.
Mapping results
The bowtie_results folder contains the results of the reads mapping. The results of first mapping step are available in the bwt2_glob folder, and the seconnd step in the bwt2_loc folder. Final BAM files, reads pairing, and mapping statistics are available on the bwt2 folder.
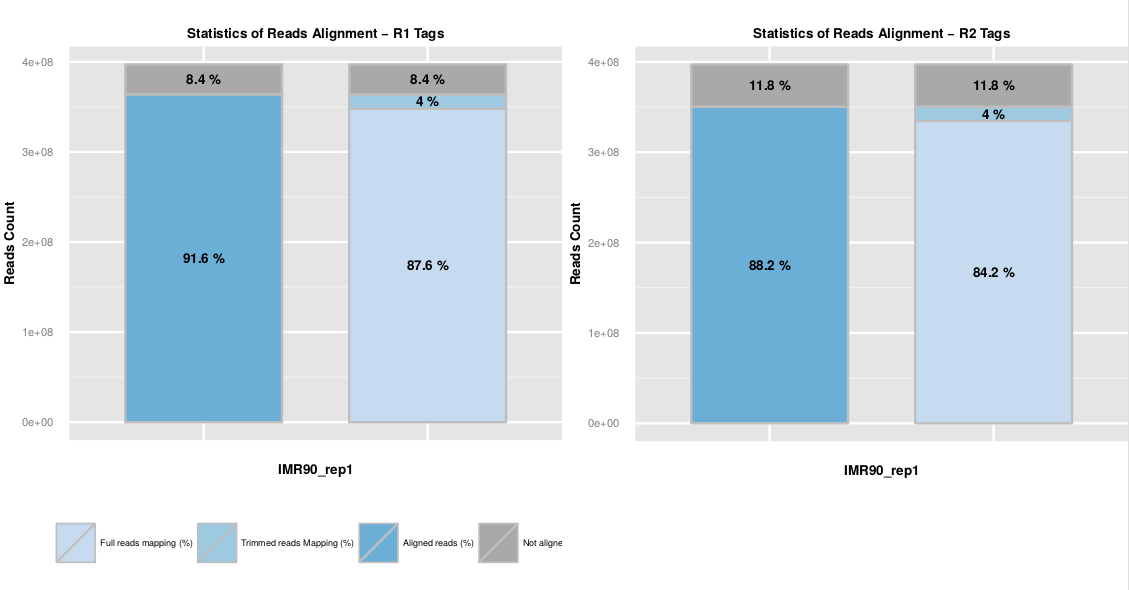
The read mapping statistics are represented as a barplot of the fraction of aligned R1 and R2 reads. The first bar represents the overall mapped reads fraction, and the second bar distinguish both mapping steps.
Mapping statistics are available in the ‘.mapstat’ files. The total mapping statistics per sample are available in the ‘SAMPLE_NAME.mmapstat’ file.
Usually, a high fraction of reads is expected to be aligned on the genome (80-90%). Among them, we usually observed a few percent (around 10%) of step 2 aligned reads. Those reads are chimeric fragments for which we detect a ligation junction. An abnormal level of chimeric reads can reflect a ligation issue during the library preparation.
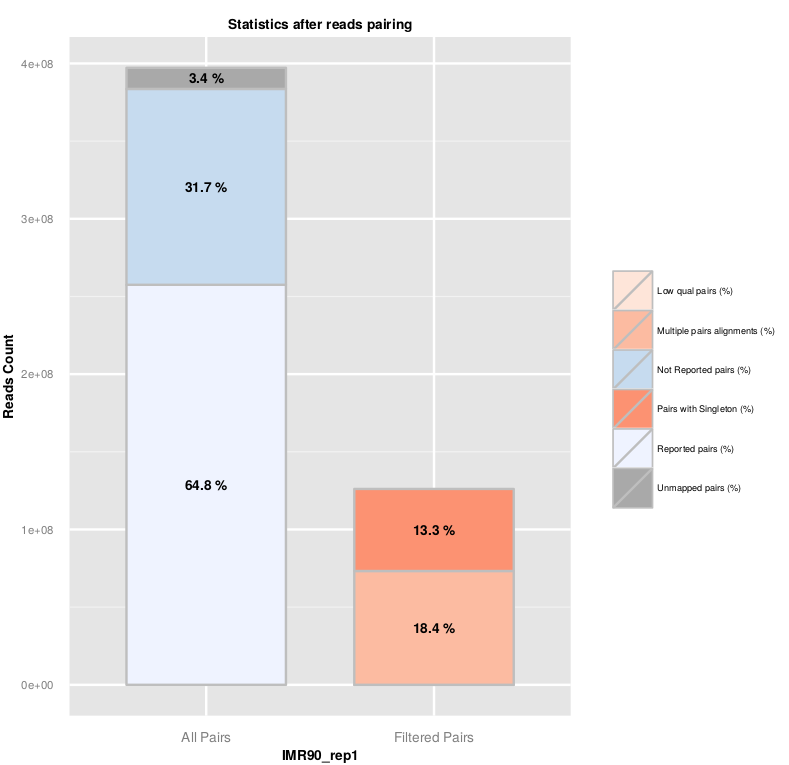
Once R1 and R2 reads are aligned on the genome, HiC-Pro reconstruct the pairs information. The pairing statistics are summarized in the plot below and available in the ‘.pairstat’ files. The combined pairing statistics per sample are available in the ‘SAMPLE_NAME.mpairstat’ file.
The fraction of singleton or multi-hits depends on the genome complexity and the fraction of unmapped reads. The fraction of singleton is usually close to the sum of unmapped R1 and R2 reads, as it is unlikely that both mates from the same pair were unmapped.
List of valid interaction products
The hic_results folder contains all Hi-C processed data, and is further divided in several sub-folders.
The hic_results/data folder is used to store the valid interaction products (‘.validPairs’), as well as other statisics files.
The validPairs are stored using a simple tab-delimited text format ;
read name / chr_reads1 / pos_reads1 / strand_reads1 / chr_reads2 / pos_reads2 / strand_reads2 / fragment_size [/ allele_specific_tag]
One validPairs file is generated per reads chunck. These files are then merged in the allValidPairs, and duplicates are removed if specified in the configuration file.
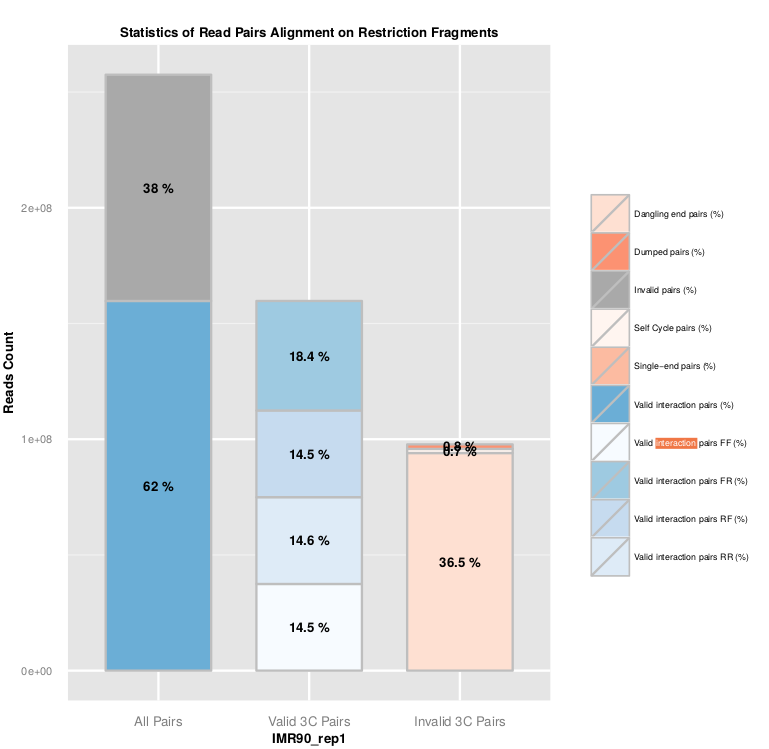
Statistics about read pairs filtering are available in the ‘.RSstat’ files, and combined in the ‘SAMPLE_NAME.mRSstat’ file.
The ligation efficiency can be assessed using the filtering of valid and invalid pairs. As the ligation is a random process, 25% of each valid ligation class is expected. In the same way, a high level of dangling-end or self-circle read pairs is associated with a low quality experiment, and reveals a problem during the digestion, fill-in or ligation steps.
In the context of Hi-C protocol without restriction enzyme, this analysis step is skipped. The aligned pairs are therefore directly used to generate the contact maps. A filter of the short range contact (typically <1kb) is recommanded as this pairs are likely to be self ligation products.
In case of allele specific analysis, an additional statistics file ‘assplit.stat’ is available with the fraction of read pairs assigned to the parental genomes. Note that allele specific assignment is also available from the ‘.RSstat’ files. Statistics from the ‘assplit.stat’ are usually different from the ones in the ‘.RSstat’ as they are calculated on the valid pairs after duplicates removal, whereas statistics on the ‘.RSstat’ files are calculated for each read chunck before duplicates removal.
Intra and inter-chromosomal contact maps
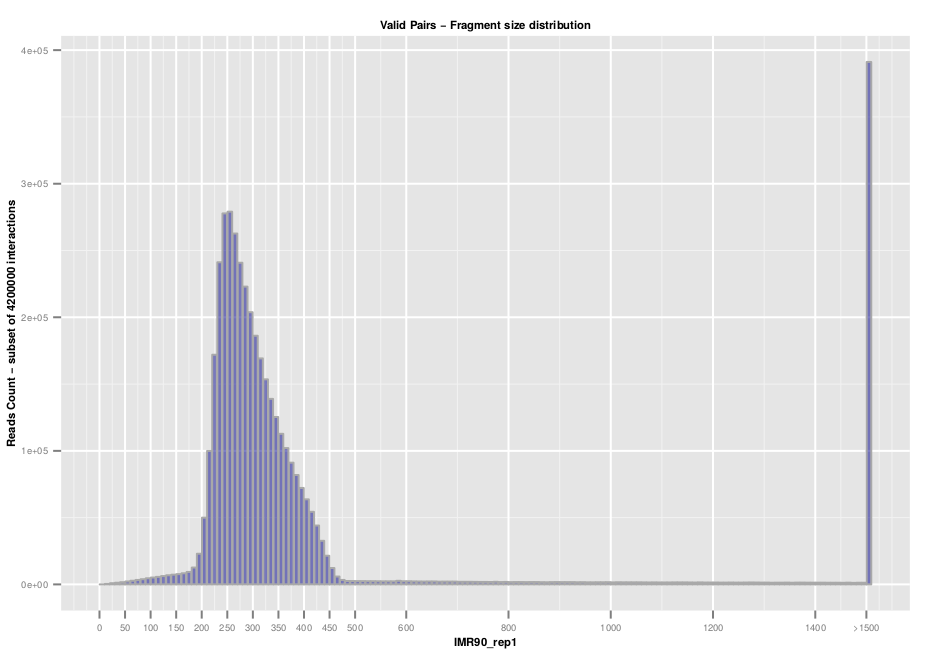
Additional quality controls such as fragment size distribution can be extracted from the list of valid interaction products. We usually expect to see a distribution centered around 300 pb which correspond to the paired-end insert size commonly used.
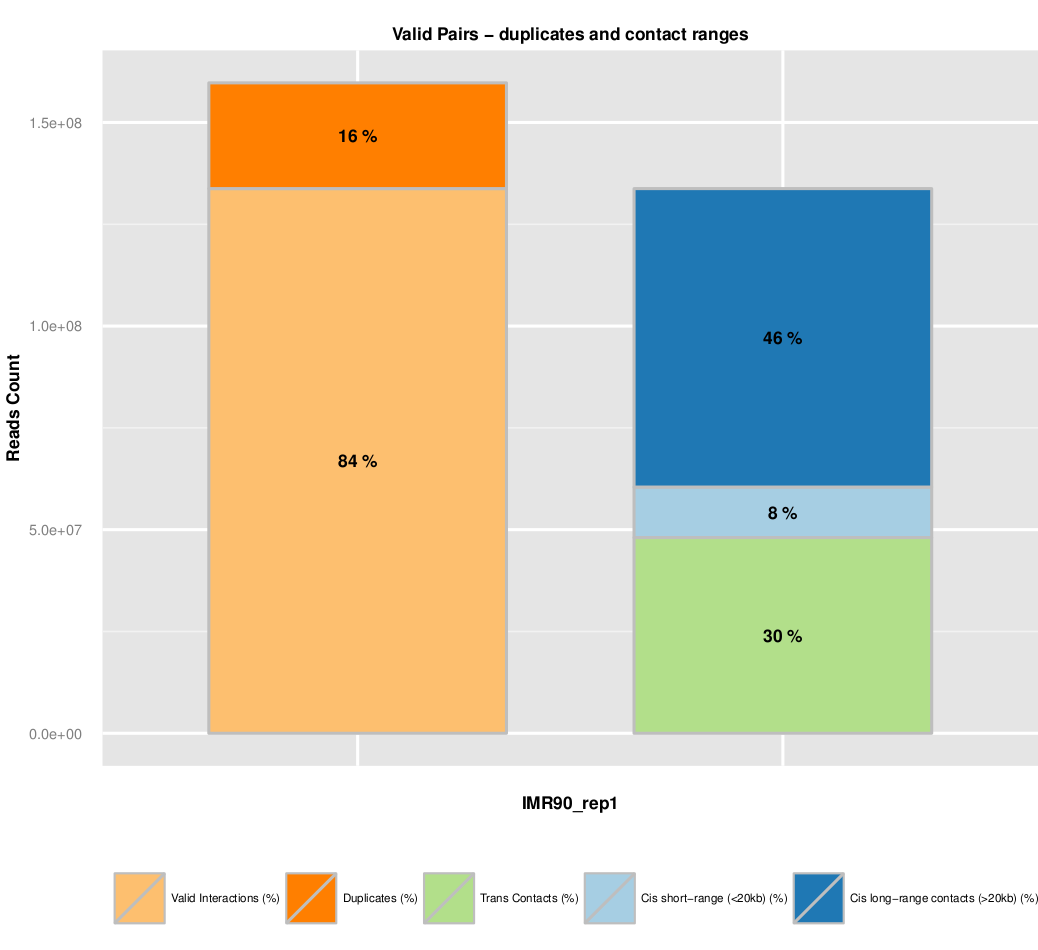
The fraction of dplicates is also presented. A high level of duplication indicates a poor molecular complexity and a potential PCR bias.
Finally, an important metric is to look at the fraction of intra and inter-chromosomal interactions, as well as long range (>20kb) versus short range (<20kb) intra-chromosomal interactions.
The contact maps are then available in the hic_results/matrix folder. Raw contact maps are in the raw folder and normalized contact maps in the iced folder.
The contact maps are generated for all specified resolution (see cnfiguration file)
A contact map is defined by :
- A list of genomic intervals related to the specified resolution (BED format).
- A matrix, stored as standard triplet sparse format (i.e. list format). Based on the observation that a contact map is symmetric and usually sparse, only non-zero values are stored for half of the matrix. The user can specified if the ‘upper’, ‘lower’ or ‘complete’ matrix has to be stored. The ‘asis’ option allows to store the contacts as they are observed from the valid pairs files.
A   B   10
A   C   23
B   C   24
(...)
This format is memory efficient, and is compatible with other analysis softwares such as the HiTC Bioconductor package or the HiCPlotter software.